Collaborators:
Melissa Daria, Thayer Thomas, Gabrielle Langlois, and Wisam Salah
Introduction and Problem:
The LD-50 of a compound simply means the individual dose of that compound that is required to kill 50% of a population of something. This is calculated in order to assess the risks of certain chemical compounds. By using a dose-response experiment in which many different populations of test organisms are exposed to various doses of that compound, scientists are able to calculate the LD-50 of the compound. The data can then be used to discuss and manage risks involved when using that compound. According to the background information provided for this lab, it is suspected that salt applied to highways for deicing may affect the growth of nearby vegetation. By conducting this dose-response experiment using radish seeds and different salt concentrations, the amount of salt required to kill 50% of a radish seed population will be calculated, thus evaluating the risk of deicing highways with salt. Many things discussed in this lab include a dose-response curve as well as serial dilution. A dose-response curve is a curve plotting the relationship between the dose of a drug administered and its pharmacological effect. On the contrary, serial dilution is a lab technique in which a substance is decreased in concentration in a series of proportional amounts.
Hypothesis:
If radish seeds are exposed to 12.5% of the salt solution, then 50% of the radish seed population will die, but, the seeds germinated radicles will be much larger than those of the control group.
Parts of an Experiment:
Materials:
Methods and Procedure:
Collecting Data and Plotting Results
You will measure the response of the radish seeds at various salt concentrations. After the seeds have germinated, count the number of seeds that germinated and measure the length of each radical (embryonic root). After recording your results, you will create two graphs (% seed germination and dose-response curve) to help you analyze the data collected.
Data Analysis:
Melissa Daria, Thayer Thomas, Gabrielle Langlois, and Wisam Salah
Introduction and Problem:
The LD-50 of a compound simply means the individual dose of that compound that is required to kill 50% of a population of something. This is calculated in order to assess the risks of certain chemical compounds. By using a dose-response experiment in which many different populations of test organisms are exposed to various doses of that compound, scientists are able to calculate the LD-50 of the compound. The data can then be used to discuss and manage risks involved when using that compound. According to the background information provided for this lab, it is suspected that salt applied to highways for deicing may affect the growth of nearby vegetation. By conducting this dose-response experiment using radish seeds and different salt concentrations, the amount of salt required to kill 50% of a radish seed population will be calculated, thus evaluating the risk of deicing highways with salt. Many things discussed in this lab include a dose-response curve as well as serial dilution. A dose-response curve is a curve plotting the relationship between the dose of a drug administered and its pharmacological effect. On the contrary, serial dilution is a lab technique in which a substance is decreased in concentration in a series of proportional amounts.
Hypothesis:
If radish seeds are exposed to 12.5% of the salt solution, then 50% of the radish seed population will die, but, the seeds germinated radicles will be much larger than those of the control group.
Parts of an Experiment:
- Independent Variable: Concentration of salt added to the radish seeds.
- Dependent Variable: Number of germinated seeds and the average length of them.
- Controlled Variables: plastic bags, distilled water, napkins, amount of sunlight, amount of time grown.
- Control Group: Seeds exposed to distilled water only, and 0% salt.
- Experimental Group: Seeds exposed to numerous concentrations of salt
Materials:
- 6 ziploc bags
- 60 seeds
- 12 napkins
- Concentrated salt water solution
- Distilled water
- Graduated cylinder
- Metric ruler
Methods and Procedure:
- Use the graduated cylinders and test tubes to prepare the various concentrations as shown below.
- Label all six bags with your group number, the dish #, and a percent concentration of chemical:
- Dish #1: 0%
- Dish #2: 6.25%
- Dish #3: 12.5%
- Dish #4: 25%
- Dish #5: 50%
- Dish #6: 100%
- Put two napkins together and cut them so that they fit into the bag.
- Put on the safety goggles and latex gloves. Carefully pour the salt solution onto the napkins, making sure to match the numbers and concentration percentages of the dish.
- Count out 10 seeds. Carefully place the seeds on the moist napkins in the bag.
- Repeat steps 3-5 for the other dishes.
- Place the seed dishes in a stack, lying flat with the seeds up. Put the seeds in the spot designated by your teacher.
Collecting Data and Plotting Results
You will measure the response of the radish seeds at various salt concentrations. After the seeds have germinated, count the number of seeds that germinated and measure the length of each radical (embryonic root). After recording your results, you will create two graphs (% seed germination and dose-response curve) to help you analyze the data collected.
- Remove the lid of the control dish. Count the number of seeds that germinated. Calculate the percentage of seeds that germinated and record in Table 2. Note: if fewer than 80% of the seeds in this control sample germinate, this indicates a problem with the experiment.
- Measure the length of the radical for each of the germinating lettuce seeds to the nearest millimeter (mm). Look carefully at each sprout to make sure you are measuring just the root, not the shoot as well. In the picture below, you would measure just the part between the two arrows, not the shoot and cotyledons to the left.
- Repeat steps 1-2 for each petri dish.
- For each treatment, calculate the mean radical length for each salt solution. Add the total radical lengths for each salt solution and divide by the total number of seeds that germinated. Do not include data from seeds that did not germinate. Record data in column labeled, “Mean Radicle Length (mm).”
- Make a line graph from the data collected to show a dose-response curve. The horizontal axis should be for the independent variable, dose (concentration of salt solutions). The vertical axis should be for the dependent variable, response (mean radical length). Remember to give the graph a title.
- To help you answer “Did the radical length increase or decrease in length as compared to the control?” subtract the mean radical length of each treatment from the mean radical length of the control. Record your answers in the column, “Difference in Radicle Length” on the data table.
- Make a line graph to show the percentage of seeds that germinated for each salt solution.
Data Analysis:
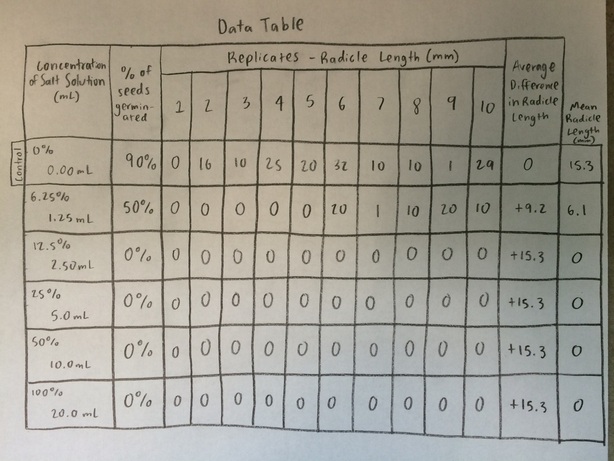
Data Table
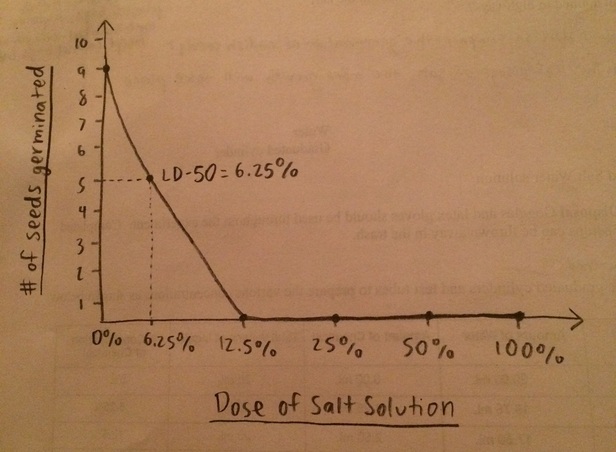
Dose-Response Curve
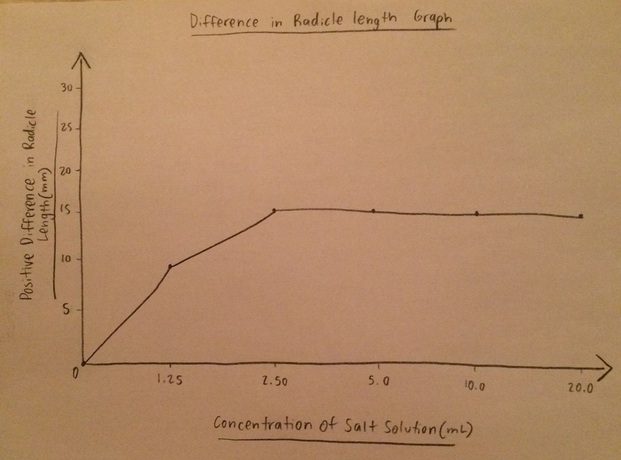
Radicle Lengths
|
|
Analysis:
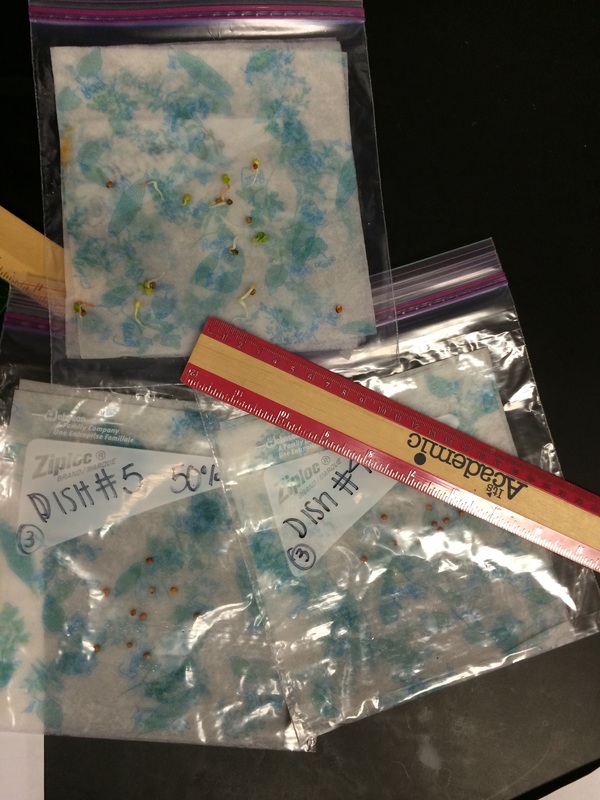
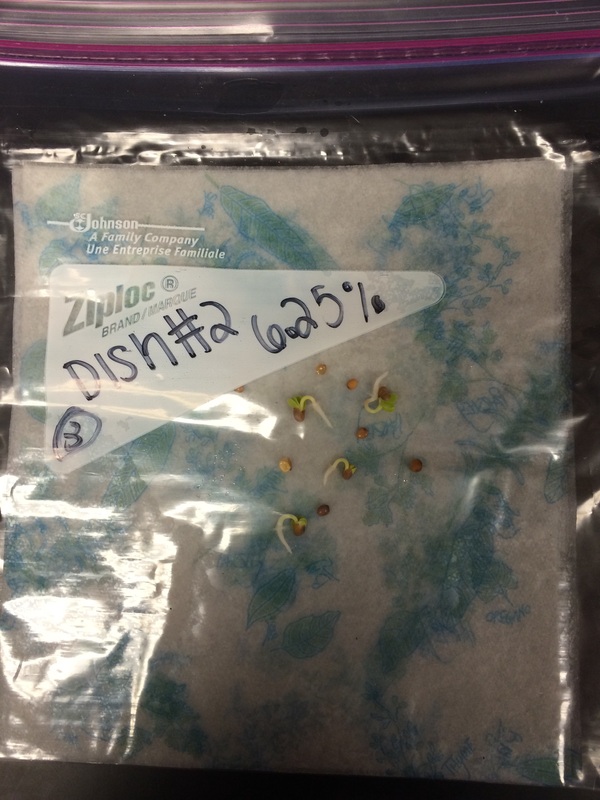
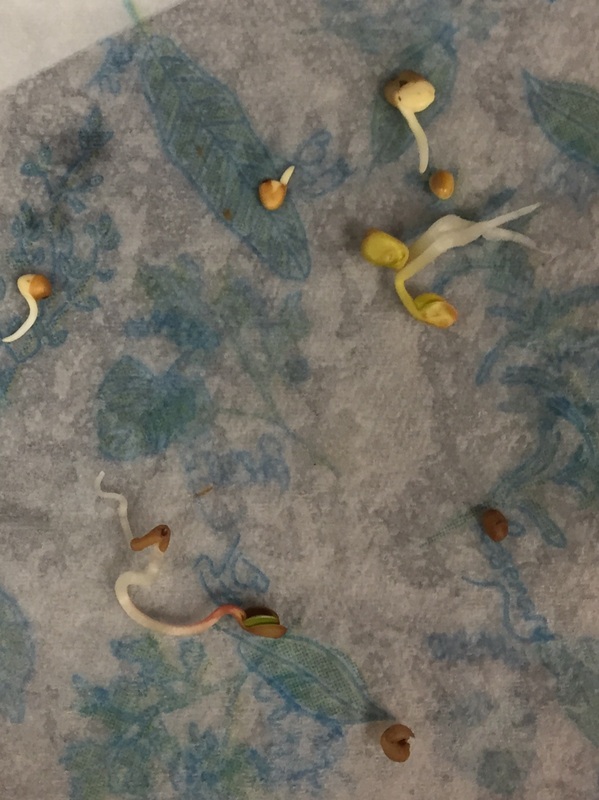
After three days of allowing our radish seeds to germinate, our group took some photos (left) to show some progress in our experiment. It was evident that Dish #2 (6.25% salt solution) was able to keep pace with that of the control group. Dish #2 also turned out to be our estimated LD-50, 1.25mL of salt solution. Unfortunately, no other dish had any radish seeds sprout, thus altering our data completely. I would attribute this trend to the fact that salts can actually adjust vegetative growth. 90% of our group's control group, which contained 0% salt solution, survived and thrived in its salt-less environment. A dramatic drop in numbers took place when 6.25% salt solution was added (photo 2). All the data collected following our 6.25% group fell off completely, showing 0% growth in the final four bags tested. Also, shown above, is a "Difference in Radicle Length Graph". This graph visualizes how far off each bag's differing radicle length was compared directly to that of the control. Finally, after inducing our group data onto a dose-response curve, the LD-50 of salt on radish seeds was predicted to be 1.25mL, meaning that if a population of radish seeds were exposed to 1.25mL of salt solution, half of the population would not germinate. |
Conclusion:
This LD-50 lab was deliberated in order to answer the question of how radish seeds would respond to various concentrations of salt. The data collected could not prove the hypothesis, which stated that if radish seeds are exposed to 12.5% of the salt solution, then 50% of the radish seed population will die, but, the seeds germinated radicles will be much larger than those of the control group. The radish seeds did not have a projected LD-50 of 12.5% salt solution, rather, they had an LD-50 of 6.25%. This dosage was even lower than what the hypothesis projected, which also sought to deem that some small concentrations of salt added to the water would have a reasonable and lasting effect on the germination of the radicles. However, the divergences between the hypothesis and our group data can stimulate some confusion. This can be attributed to some of the obvious conclusions resolved in this lab. For instance, not one radish seed in sample numbers 3-6 germinated, and the salt was clearly the cause of this. Higher concentrations of salt managed to have no growth, so this data was most likely skewed by the factor of increase salt solutions in the experiment. Perhaps the substances were not mixed correctly on day 1, or the seeds could have been bad from the start. Also, an increase in days for the lab to take place could possibly have a lasting effect on the outcome of the bags that had no seed germination. For these reasons, it is warranted to omit parts of the group data from the conclusions. However, if the focus is shifted from individual inconsistencies in the data to the overall trends that they provide, then the experiment gains significance. An overall agreement was met, where other groups data and our group data show that both the germination and radicle growth of radish seeds are hindered by an increase in concentration of salt. Therefore, the data collected proves the hypothesis to be inaccurate.
To answer the pivotal question in this lab, it demands examination of two trends. The first is the trend in germination, and the second is the trend in radicle length as the salt concentration is increased. The first trend is what indicates the LD-50 of the salt solution. It is obvious that the trend in germination is that less seeds will germinate as they are exposed to higher levels of salt. The reason that salt can be harmful to seeds in large concentrations is that they need water to sprout, and salt does not help the cause. Salt actually dissolves in water, and when it does this "sodium and chloride ions separate and may then harm the seeds" (Perry, Leonard). A similar singularity goes on when salt is added to highways in order to deice them. Salt accumulation along roads can harm vegetation nearby because salt absorbs water. Thus, salt can definitely be toxic to plants, and the effects do not stop at germination. The second trend is best explained through the idea of fertilizers. Fertilizers are great because they allow for increased crop yields in a world that needs more food to feed a growing human population. However, overusing fertilizers has been shown to decreases soil fertility and thus impede vegetative growth. Thus, the salts that the radish seeds are being exposed to are actually helping the seeds grow longer radicles, but the affect reverses itself once the salt concentration becomes too high. At this point, the salt makes it harder for the roots to absorb more water and thus they cannot grow past the length of the control or lower salt concentrations.
Citation(s):
"Lethal Dosage (LD50) Values." EPA. Environmental Protection Agency, 27 June 2012. Web. 13 Sept. 2014. <http://www.epa.gov/oecaagct/ag101/pestlethal.html>.
Perry, Leonard. "Salt Damage to Plants." University of Vermont. N.p., n.d. Web. 13 Sept. 2014 <http://www.uvm.edu/pss/ppp/articles/salt1.htm>.
"Road Salts May Drive Away Your Plant's Nutrients." Heartland Connection. N.p., 14 Jan. 2015. Web. 04 Feb. 2015. <http://www.heartlandconnection.com/news/story.aspx?id=1149090#.VNLeoylbSkg>.
By: Noah Nelson
